

How to Inspect Element in Safari Browser
Ever found yourself wondering what makes a webpage tick? Maybe you want to peek behind the scenes, see how a button works, or just feel like a tech detective. Good news — Safari has a built-in tool just for that. It’s called Inspect Element, and it lets you look under the hood of any webpage like a pro (or at least *feel* like one).
TL;DR
If you want to inspect elements in Safari, you need to turn on the Develop menu first. Go to Safari settings, enable developer tools, and then right-click any part of a webpage to inspect it. You’ll see the HTML, CSS, and even console logs. It’s super handy for debugging, learning code, or just satisfying your curiosity.
Step 1: Open Safari Preferences
Before you can use Inspect Element in Safari, you need to unlock the right tools. Let’s start with enabling Safari’s Develop menu.
- Open Safari on your Mac.
- Click on Safari at the top left of your screen.
- Select Settings or Preferences from the dropdown (depends on your macOS version).
- Click on the Advanced tab.
- At the bottom, check the box that says “Show Develop menu in menu bar.”
You did it! You’ve unlocked a new power. Your Safari window now has a brand-new menu up top called Develop.

Step 2: Use the Inspect Element Tool
Now that the Develop menu is on, it’s time to use Inspect Element. There are two ways to access it:
Option 1: Right-Click Method
- Open any website in Safari.
- Right-click (or Control + Click) on the part of the page you want to inspect.
- Select “Inspect Element” from the menu.
Option 2: Use the Develop Menu
- Click on Develop in the top menu bar.
- Select “Show Web Inspector.”
Both methods open the same tool: the Web Inspector. This is your new playground for finding out how websites are built.
What Can You Do With Inspect Element?
Here’s where the fun begins. The Web Inspector gives you access to the building blocks of the webpage. Let’s break it down:
- Elements Tab: View and edit HTML and CSS live.
- Console Tab: Run JavaScript commands or see errors and alerts.
- Network Tab: Watch how files load in real time.
- Resources Tab: See and explore images, scripts, and storage data.
It sounds technical, but don’t worry. Let’s take it one step at a time.
Editing HTML Like a Wizard
Go to the Elements tab (it’s probably the default one that opens up). You’ll see lines of HTML code that make up the page. Hover over any element, and Safari highlights it on the webpage. Cool, right?
Want to change text or edit something just for fun?
- Find the line of code connected to what you want to change.
- Double-click the element name or the content between tags.
- Type in your changes and press Enter.
You’ve now customized a webpage (it’s only temporary, but feels a little magical).
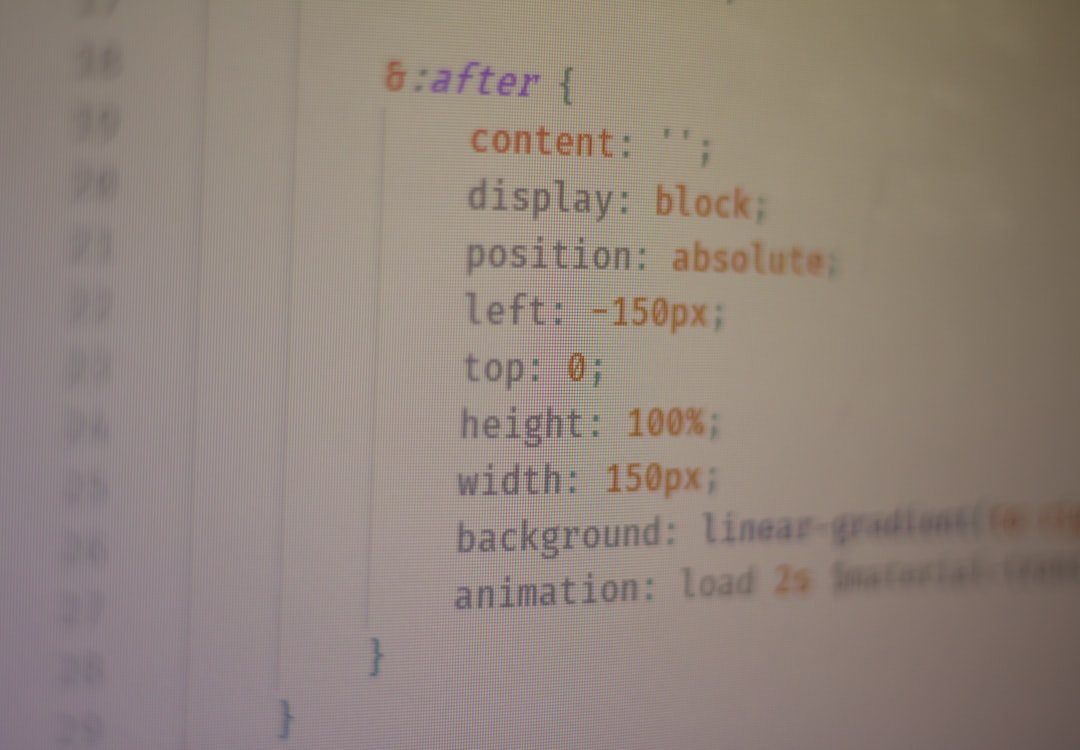
Playing With CSS
Click on an element in the HTML code. On the right side, Safari shows the CSS styles for that element.
You can:
- Modify values (like change colors, fonts, margins).
- Turn off styles by unchecking the checkboxes.
- Add new CSS rules using the plus sign (+).
It’s like Photoshop, but for code. You can design, redesign, and experiment — all without breaking anything.
Use the Console to Feel Like a Hacker
Well, okay — maybe not a hacker, but definitely like someone who knows their way around code. The Console tab lets you run JavaScript commands.
Try this: go to the Console and type this in:
console.log("Hello from the Console!");
Then press Enter. Boom! It prints your message. This is how developers test code quickly or debug errors. Don’t worry — you won’t break anything by playing around.
Looking at Network Activity
If you’re curious about what files are being loaded on a webpage — images, CSS files, JavaScript, and more — the Network tab is your go-to.
Refresh the page while keeping the Network tab open, and watch all the components load in real time. You’ll see status codes, types of files, and how long each file took to load.
It’s super helpful when diagnosing slow pages or checking if a file was loaded correctly.
Inspect on iPhone or iPad Using Safari
Want to inspect a mobile site directly from your Mac? You can! Safari makes this possible too.
- Connect your iPhone or iPad to your Mac using a USB cable.
- Open Safari on your Mac.
- On your iOS device, open the website you want to inspect.
- Click the Develop menu on your Mac.
- You’ll see your device listed. Hover over it and choose the active page to inspect it.
This is incredibly useful if you’re building responsive websites or debugging how a page looks on mobile.

Why Use Inspect Element?
You might be wondering: “Why would I ever need to do this?” Here are some fun and practical reasons:
- Learn HTML/CSS: Inspect Element is like a free classroom built into your browser.
- Debug Issues: See why an element isn’t styled correctly or why it’s not working.
- Copy Content: Need to grab code snippets or text quickly? Easy.
- Prank Friends: Change text on a news site (temporarily) and impress your pals.
Note: Changes Are Temporary
Just a heads-up: Any edits you make with Inspect Element are for your eyes only. They disappear when you refresh the page. If you want to make permanent changes, you’ll need to modify the site’s actual code — which usually requires access to the backend.
Final Safari-Savvy Tips
You’re now equipped with the basics, but here are a few bonus tips to level up:
- Use Cmd + Option + I to open Developer Tools quickly.
- Click on Console errors to jump directly to code.
- Search the page with Cmd + F inside the web inspector.
- Right-click in the Elements tab to copy code or capture screenshots.
Wrap-Up
Congratulations! You’re now part of the web tinkerer’s club. With Safari’s Inspect Element tool, you can explore, experiment, and learn the secrets behind any webpage. It’s a fantastic way to build your confidence with web design and development — all in your browser.
So the next time you ask, “How does this site do that?” — just right-click and inspect. Happy exploring!
")
