
90% of the design of any presentation is subtraction
90% of the design of any presentation is subtraction
The classic way to make a presentation, which appeared with PowerPoint, is to copy all the content from a 10-15 page Word document onto slides.
So were born slides – a cross between document and presentation.
Impossible to read diagrams:
10+ points, which can still have 4-5 sub-points:
Benefits Not Behind All Slide Elements
And this is just the beginning …
Slides like these kill the presentation
You must decide what you are doing – a handout or a slide to support your presentation. If there is a lot of text and incomprehensible visual solutions on a slide, then people stop listening to you and start reading and studying the slide.
Don’t make your slides a barrier between you and your audience. Throw out the excess. To do this, you need to know what can be subtracted.
Ask yourself the question: “What is the most important thing?”
There are too many secondary and even tertiary information on the slides. Don’t try to use all the content that you have at your disposal.
When you write a film script, you need to structure the story so that each scene should move the hero one step towards his goal.
In a presentation, a slide is a scene from your own movie. Each slide should develop your story and lead the audience to a premeditated climax. Always keep in mind the purpose for which you started making your presentation and look at the content of the slide through the lens of benefit.
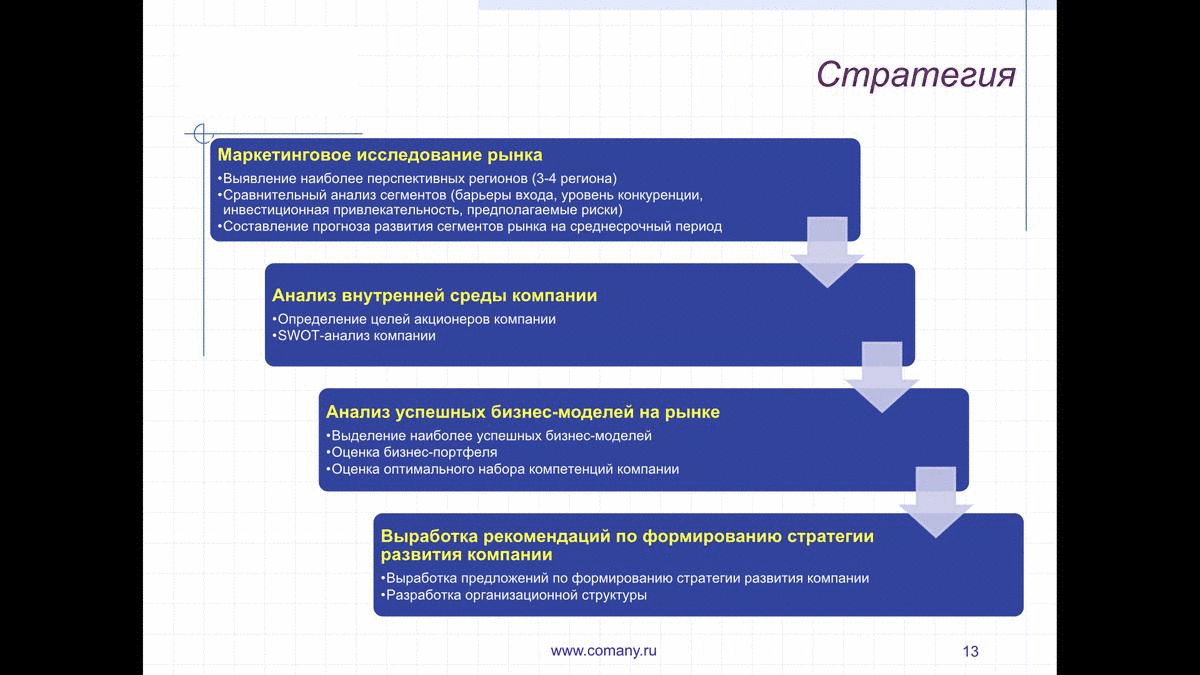
Look carefully – the text completely duplicates the scheme:
Come on, it won’t be superfluous!
Will be! Leave only what is important. Just enough to make the idea of the slide you want to convey clear.
I can’t remove anything – everything is important here
If everyone is special, then no one is special. It does not happen that all information is equal in importance. It may be that several ideas are heaped together — then just break them down into separate slides.
I will then be asked where the numbers came from
Prepare ahead of time – take just one graph, tidy it up, and place it on the slide along with a clear heading. Leave all other tables, graphs and formulas for calculation in Excel and distribute before the speech in print format. If the presentation is to be sent, then it’s even easier – attach the files in the attachment with the presentation.
Think about convenience and do as easy as possible – the more difficult it will be for you to make a mistake.
 Quick slide redesign in PowerPoint
Source: sergeyslutsky.com
…
